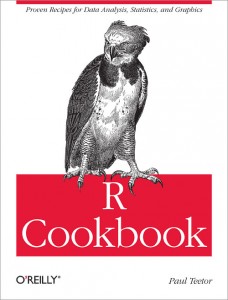
 This is the second installment in my irregular series of book reviews for O’Reilly Media. In the interests of full disclosure, I received this ebook for free in exchange for this review. I get to keep it even if I hate it and they will publish this review on their web site even if I trash the volume completely.
The book under the microscope this time is “The R Cookbook” by Paul Teetor. For those of you unfamiliar, R is a powerful, free, open source programming language and environment used for statistical programming and analysis. It features a rich graphical display language to assist in data visualization. You can think of it as a scripting language akin to Excel Spreadsheets or a variant of MATLAB focused on statistics. The language includes a full suite of community-developed, sector-specific libraries that provide re-usable functions typical of industry needs. These libraries indicate the areas in which R has found popularity.This includes the worlds of finance, genomics, statistics and data science.
The R Cookbook describes itself as a book for the user who is somewhat familiar with R but needs easy access to useful techniques and common R program building blocks. The book is arranged as a series of recipes. Each recipe describes a problem that you might trying to solve and then a solution or possible solutions to resolve the issue. For instance “You want a basic statistical summary of your data” is described as the problem to solve and then the text provides you with at least one approach to providing a solution to that problem.
The structure of the book is such that it begins with simpler recipes and builds its way up to more complex ones. In fact, because of this structure, I would recommend this book as a great tool to learning R for the novice despite the book’s self-identification of that being its incorrect use. The rational behind this recommendation is that the beginning recipes are tasks like “How do I install R?” and similar novice tasks. It then builds slowly from there into a use cases and scenarios of increasing complexity and utility.
The book includes great examples that illustrate the power of R in doing data transformation, probability and statistical analysis. It also shows how you can use R to provide meaningful graphical representations of your results. The chapter on ‘Useful Tricks’ is what seals the deal for me providing 19 great pointers to allow you to improve your R analyses.

No comments yet.
Leave a comment